Predicting Halifax Transit Ridership
Overview
If you've ever used Halifax transit, you'd know that sometimes the fleet is over-allocated, sometimes it's under-allocated; by this I mean you'll ride a nearly-empty bus that runs the route every 30 minutes, but sometimes you'll try to board an overly-stuffed standard bus and you find yourself wondering why they don't send an articulated bus on that route for that time of day.
I set out on this Transit Ridership project with the goal of analyzing the passenger counts for various routes with the goal of building a machine learning model to better match vehicle allocation to improve rider experience, and lower operating costs through optimized vehicle allocation. As a solo project, I took ownership of every level—from data pipeline orchestration to model optimization.
Detailed Breakdown
Data Collection & Architecture
The daily pipeline logic downloads the most recent APC (Automated Passenger Count) data from ArcGIS, joining it with relevant columns from Static Transit data (GTFS) to extract bus stop coordinates. I processed approximately 2.5 million historical records spanning 2022-2025. To optimize performance, I implemented a clustered index on the Staging table for fast lookup during the JOIN phase, and non-clustered indexes on Fact table foreign keys to accelerate the de-duplication check.
Data Sources:
- ArcGIS Open Data Hub — APC (Automated Passenger Count)
- GTFS (General Transit Feed Specification) — Static Transit Scheduling Data
ETL Pipeline & Methodology

The daily pipeline includes 2 Python scripts that execute several other Python scripts in succession as subprocesses, ensuring each step of the pipeline executes in the correct order. Before the daily pipeline, I loaded and processed historical data into the database with proper indexing for fast retrieval.
Tech Stack:
- Languages: Python, SQL
- Data Manipulation: pandas, NumPy
- ML Framework: scikit-learn (RandomForestRegressor, StandardScaler, LabelEncoder)
- Model Persistence: joblib
- Database: Microsoft SQL Server
- DB Connectivity: pyodbc + ODBC Driver 17/18
- Scheduling: Windows Task Scheduler / Batch file
- Time/Date Handling: holidays (ca.ns), datetime
- Visualization: matplotlib, seaborn


Challenges & Optimization
Initially, I started with only a few features from the raw data, but ML trial runs revealed poor accuracy. I took a step back and added multiple temporal columns (year, month, day, day of week, day of year, holiday flag, weekend flag, academic term). This significantly improved model performance.
I discovered that obtaining exact coordinates was challenging—daily passenger counts don't include exact coordinates for every 30-minute increment. I made educated guesses based on time and route, cross-referencing with stop locations. I split coordinates into both basic latitude/longitude (first stop within the 30-minute timeslot) and calculated centroid coordinates for better prediction accuracy.
The raw APC data contained physically impossible counts (highest value: over 7,000 on a single bus in a 30-minute slot), indicating flawed source data. I applied Tukey outlier filtering to focus on the central bulk of the data, ensuring the ML model trained on realistic values.
With 2.5M records and a compute-intensive model (Random Forest), memory and CPU management was critical. I used safe_cores = max(1, total_cores - 2) to prevent system crashes. I optimized the Random Forest by capping tree depth at max_depth = 30 to reduce pickle file size and set max_samples = 0.5 to train each tree on 50% of the data without sacrificing RMSE.
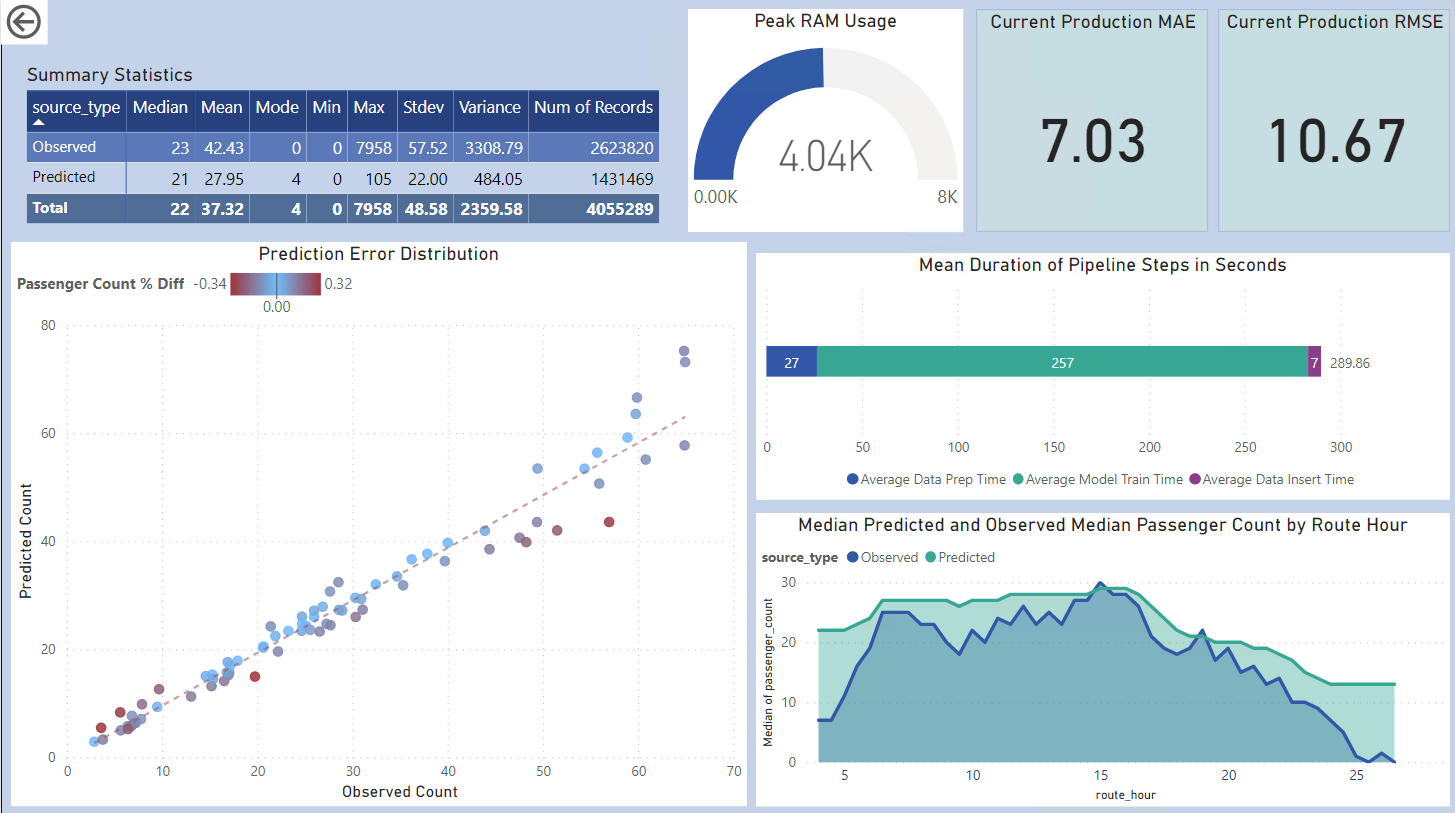
Key Metrics & Outcomes
The optimized Random Forest model achieved strong predictive performance on held-out test data, enabling accurate forecasting of ridership across different routes and times of day. The pipeline now runs daily, automatically updating predictions to support operational decisions for vehicle allocation.
Conclusion
This project demonstrated the power of combining solid data engineering with machine learning to solve real operational challenges. The challenge of working with messy, large-scale data taught me the importance of exploratory analysis and iterative feature engineering. By addressing data quality issues and optimizing for resource constraints, I built a scalable pipeline that continues to support Halifax Transit's vehicle allocation decisions.