Cumberland County Flood Mapping Dashboard
Overview
The Chignecto Isthmus, a narrow strip of land connecting Nova Scotia to the rest of Canada and serving as a vital trade corridor, faces well-documented flood risk from both the Bay of Fundy and the Northumberland Strait. Applied Geomatics Research Group (AGRG) has robust, precise elevation models and detailed flood simulations, but the data lives in specialist GIS software.
The primary goal of this project was to bring the science to the open, in a publicly accessible web dashboard where anyone can visualize flood elevation scenarios, identify vulnerable infrastructure, and facilitate municipal emergency planning. At the same time, the sidebar allows you to see what the tide is doing right now at four nearby monitoring stations.
My Role & Data Sources
I took the role of Data Specialist, with my primary focus on processing underlying lidar-derived data sourced by Applied Geomatic Research Group into a web-optimized format.
Data Sources:
- LIDAR/GIS – Applied Geomatics Research Group (AGRG) – Hydro-conditioned 1-metre DEM of Cumberland County; Cloud-Optimised GeoTIFF rasters representing flood extents from 0 m to 11 m in 0.1 m increments for both Bay of Fundy and Northumberland Strait coastlines. Vertical datum: CGVD2013 (NAD83/CSRS v6, UTM Zone 20N)
- TIDES API – Canadian Hydrographic Service / DFO-MPO – Real-time water level data from four tide monitoring stations (Saint John NB, Pointe-du-Chêne NB, Charlottetown PE, Caribou NS). Raw readings converted from Chart Datum to CGVD2013 using station-specific benchmark offsets
- OpenStreetMap – Road network and critical infrastructure (hospitals, fire stations, police, community centres, clinics) across Cumberland County. Extracted via Overpass API and stored as GeoJSON
Methodology – From Raw Scientific Rasters to Web-Ready Map
The core challenge was a data engineering problem: AGRG's flood models existed as ~220 GeoTIFF rasters stored in a projected coordinate system designed for GIS software, not browsers. Getting them onto an interactive web map at full scientific resolution required building a multi-stage offline pipeline.
Initial Approach: Vector to Raster Pivot
The project began using vector shapefiles converted to GeoJSON—polygon outlines of flood extents that Leaflet could render directly. This worked at low zoom levels but struggled with the detail and file size of 1-metre-resolution data across a large region. When we received the full TIFF rasters from AGRG, we rebuilt the rendering pipeline from scratch around two raster-native approaches.
Reprojection to Web Mercator — reproject_cogs.py
The AGRG rasters arrived in EPSG:32620 (UTM Zone 20N)—the standard projection for precise geodetic work in Atlantic Canada, but incompatible with web mapping libraries which expect EPSG:3857 (Web Mercator). This script used rasterio's warp pipeline to reproject all 220 TIFFs, outputting tiled, deflate-compressed Cloud-Optimised GeoTIFFs. The COG format structures data in 256×256 pixel internal tiles, allowing efficient windowed reads—you can fetch only the portion of the raster you need rather than loading the whole file.
EPSG:32620 (UTM) → rasterio.warp.reproject(resampling=Resampling.nearest) → EPSG:3857 (Web Mercator) | GTiff, deflate compression, 256×256 tiles
PNG Pre-rendering — prerender_floods.py
The first raster-native approach pre-rendered each flood level as a single full-extent PNG image. The script reads each TIFF as a NumPy array, identifies flooded pixels, and writes them as RGBA with a fixed blue colour (rgba(37, 99, 235)) and level-scaled opacity—lower flood levels more transparent, higher levels more opaque, ranging from 25% at 0 m to 55% at 11 m. Non-flooded pixels are fully transparent.
With full resolution (downsample_factor = 1), PNG's lossless compression of mostly-transparent RGBA still achieved 10–30× file size reduction over the source TIFF.
XYZ Tile Generation — generate_tiles.py
The final raster approach generated standard XYZ map tiles—the same format used by OpenStreetMap and Google Maps. Rather than serving one large PNG per flood level, the XYZ approach pre-slices each raster into a pyramid of 256×256 pixel tiles at zoom levels 10–15. The browser only requests tiles visible in the current viewport at the appropriate zoom level.
The script calculates which XYZ tile coordinates intersect each raster's bounds using Web Mercator tile math, then for each tile uses rasterio's windowed read to extract precisely that geographic extent. Tiles with no flood data are skipped entirely, keeping the tileset compact. Each tile is RGBA PNG with level-based opacity logic.
Infrastructure Enrichment — enrich_infra_names.py
Many OSM critical-infrastructure features carried only a type tag (e.g. fire_station) with no human-readable name. This script called the Nominatim reverse-geocoding API for each unnamed point—rate-limited to one request per second per Nominatim's terms of service—resolving coordinates to a nearby village or town and constructing readable labels like "Fire Station (Amherst)".
Pre-computing Flood Risk Thresholds — compute_infra_risk.py
For the infrastructure layer to respond to the flood slider in real time, the map needs to know—for each hospital, fire station, and clinic—at what water level that facility gets inundated. Computing this live in the browser for every slider position would require intersecting every facility against every raster on every frame. Instead, this script runs the full intersection analysis once, offline. For each facility it iterates through all rasters in ascending order and performs a point-in-raster lookup, finding the minimum flood level at which the pixel beneath the facility becomes flooded. That value is stored directly in the GeoJSON, so at runtime the map only needs a single comparison per marker.
Live Tide Datum Alignment
Tide gauge readings are reported relative to each station's local Chart Datum—an arbitrary tidal baseline that differs by location with no direct relationship to land elevation. The flood model uses CGVD2013, Canada's national vertical datum. To compare a live tide reading to a flood level meaningfully, each station's reading is converted using a benchmark offset:
- Saint John NB offset: −4.755 m
- Pointe-du-Chêne NB offset: −1.478 m
- Charlottetown PE offset: −2.012 m
- Caribou NS offset: −1.757 m
Tech Stack
Output Formats: XYZ tile pyramid (z10–z15), PNG pre-rendering (RGBA + transparency), GeoJSON infrastructure layer
Data Pipeline: Python, rasterio, pyproj, NumPy
Data Sources: COG GeoTIFF, CHS IWLS API, Nominatim API, OpenStreetMap
GIS/Spatial: ArcGIS Pro, EPSG:32620 → WGS84, CGVD2013 vertical datum
Outcome & Reflection
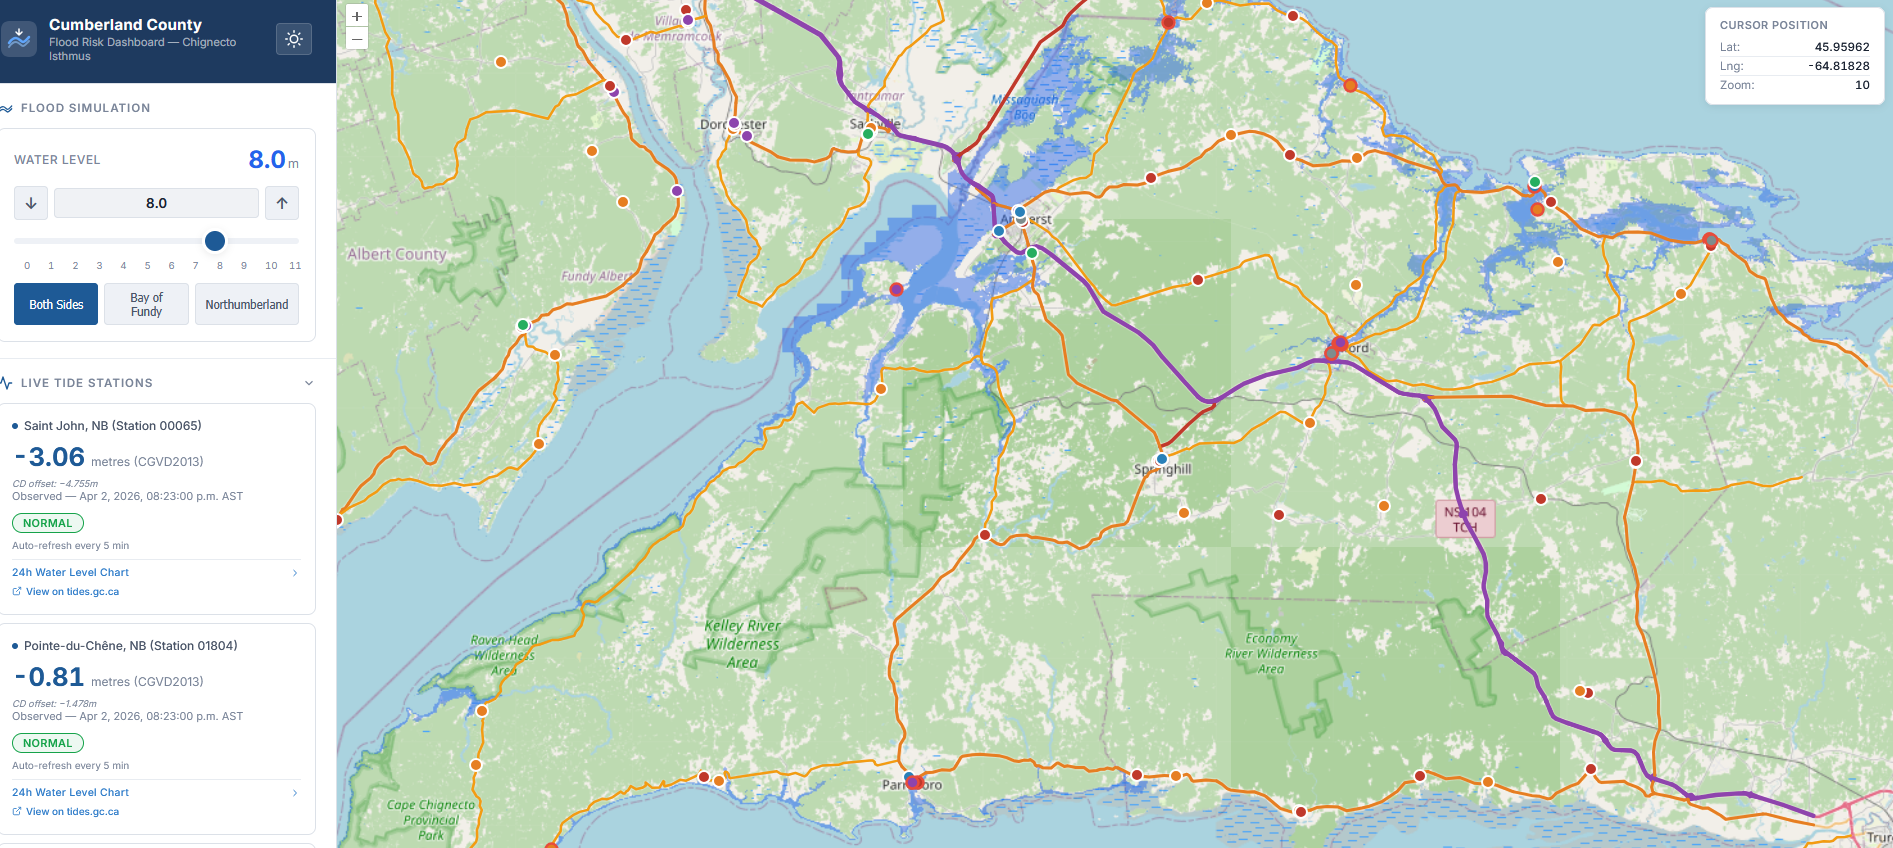
The finished pipeline transforms ~220 raw scientific GeoTIFFs into a fully deployed, publicly accessible web map that anyone can open without installing GIS software. That transformation—reprojection, tile slicing, opacity-mapped PNG encoding, infrastructure risk pre-computation, and datum alignment—is invisible to users, which is the point.
The most instructive part was the project's evolution. Starting with GeoJSON shapefiles felt natural, but it exposed the fundamental tension between vector polygon precision and raster data volume at 1-metre resolution. Moving to raster-native approaches—first full-extent PNGs, then XYZ tiles—was driven by understanding the data's actual structure, not just its surface format.
The XYZ tile approach taught me how web mapping services actually work under the hood: the tile URL convention ({z}/{x}/{y}.png), Web Mercator tile math, and why empty tiles are worth explicitly skipping. Generating that tile pyramid from a scientific raster dataset rather than consuming a pre-existing tile service made those abstractions concrete.
This project sits at the intersection of geospatial data engineering, scientific data communication, and performance-conscious pipeline design—making specialist research data genuinely usable outside the lab.
Live Site: https://cumberlandfloodmap.netlify.app/